
The famous lecture of Richard Feynman in 1959 to the American Physical Society titled There’s Plenty of Room at the Bottom gave birth to the vast field of nanoscience and nano- technology. Feynman talked about the staggeringly small world out there and gave the exam- ple of how all the 24 volumes of Encyclopaedia Brittanica can be written on the head of a pin, by demagnifying 25,000 times! It took several decades for the concept to develop into a full-fledged interdisciplinary field covering materials science, physics, chemistry, biology, mechanical and electrical engineering and medicine.
The prefix nano stands for nanometre (nm). Typical microstructural size ranges like ultrafine grain size have the lower limit of ~0.1 µm (1000 A˚ or 100 nm), whereas the atomic dimensions like a lattice parameter lie in the range of 3-10 A˚ (0.3-1 nm). Between these two ranges lies the nano range: 10-1000 A˚ (1-100 nm).
The influence of particle size on the location of phase boundaries of an equilibrium phase diagram was known for a long time. Significant shifts of the boundaries occur, when the particle size decreases to the nanorange. Examples of recent experimental results on this shift are discussed below, comparing it with calculated variations.
CALPHAD-type and other theoretical modelling of phase diagrams of nanomaterials have been attempted (Q. Jiang and C.C. Yang, Curr. Nanosci., 2008, 4, p 179-200; G. Garzel, J. Janczak-Rusch, and L. Zebdyr, CALPHAD, 2012, 36, p 52-56; A. Kroupa, T. Kana, and A. Zemanova, 4th Int. Conf. NANOCON 2012, Brno, Czech Rep., 2012, p 60-65; J. Lee and K.J. Sim,CALPHAD, 2014, 44, p 129-132). The main improvement is to include a surface energy term to the usual description of the Gibbs energy G:
G = Gref + Gideal + Gexcess + Gmagnetic + Gsurface
Thermochemical data for the energy of the reference states, magnetic energy and excess energy (to account for the deviation from ideality) are well documented for bulk materials. Estimates of the surface energy term have been made from the following equation:
Gsurface = 2CγVm/r
where γ is the specific surface energy, Vm is the molar volume, C is a shape factor and r is the radius of the particle. For a spherical particle, the shape factor C is unity. For a nanowire of cylindrical radius r and length l(l r), C turns out to be 0.5. For a nanofilm of thickness t and surface area much larger than t, t/2 substitutes for r and C = 0.333. (Garzel et al.) However, an additional term γ´ comes into picture in the case of nanofilms, due to the interfacial energy (including energy of the interface stress) between the film and the substrate on which it forms. Gsurface is inversely related to the radius of the spherical nanoparticle, to the cylindrical radius of a nanowire or to the thickness of a nanofilm.
Experimental data on phase equilibria in nanomaterials are scarce. Production of nanopowders and their characterization with respect to the particle shape and size distribution remain a challenge. For phase equilibrium studies, the standard experimental techniques such as XRD, EPMA and SEM have to be supplemented with transmission electron microscopy and three- dimensional atom probe. Additionally, accurate surface energy measurements are required.
In typical examples below, the calculated phase diagrams are compared with available experimental data. Figure 1(a) compares the calculated melting points of pure gold for nanospheres and nanowires with experimental data. (Jiang et al.) There is a depression of the melting point with decreasing size, the depression being less pronounced for nanowires. The decrease of the critical transition temperatures in the nanorange for magnetic transitions (Curie and Neel temperatures), superconducting transitions and glass transitions in polymers were calculated from theoretical models by Jiang et al and compared with experimental data. Figure 1(b) from Lee et al. depicts the Ag-Au isomorphous binary phase diagram calculated for bulk material and in the nanorange. The available experimental data on the depression of the melting points in the nanorange for pure Ag and Au are plotted on the axes, showing satisfactory agreement. Similar phase diagrams were computed by Jiang et al for other isomorphous systems such as Cu-Ni, Ge-Si and Al2O3-Cr2O3. Figure 1(c) shows the calculated Au-Cu phase diagram with a congruent melting point. In the nanosize range, this point shifts downwards and also to Cu-rich compositions (G. Guisbiers, S. Mejia-Rosales, S. Khanal, F.Ruiz-Zepeda, R.L. Whetten, and M. Jose-Yacaman, Nano Lett., 2014, 14(11),

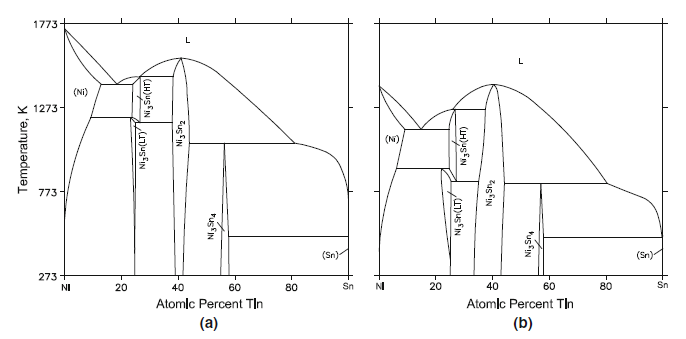
Fig. 2 Ni-Sn binary phase diagram (a) for bulk material, and (b) for nanoparticles of radius ~5 nm (Kroupa et al)
p 6718-6726). Figure 1(d) shows the calculated Ag-Cu eutectic system for bulk material, nanospheres of radius equal to 5 nm and for thin films of thickness equal to 10 nm (Garzel et al). The energy of the interface between the film and the substrate was not considered by Garzel et al. In the nanorange, a shift of the eutectic composition to the left towards Ag-rich compositions is seen.
Calculations have been reported for binary systems with several intermediate phases and invariant reactions. Figure 2 shows the Ni-Sn system for bulk material and for nanospheres (r = 5 nm) (Kroupa et al). The depression of both the stability regions of the intermetallic compounds and the invariant reactions to lower temperatures is evident. The invariant reactions remain the same. No experimental results are available for comparison.
In conclusion, the all-pervasive influence of the nano phenomenon on the phase equilibria in materials is well established. Experimentation and validation of the experimental results by computer calculations are daunting tasks. Production of nanocrystals and their characterization in terms of size and shape are by no means easy. Phase equilibrium studies require additional tools for reliable measurements in the nanorange. Theoretical modelling will surely undergo further refinements in future. This vast emerging field offers an excellent opportunity for the ‘‘brave’’ to delve into!